Clicking on the 'Roughness Profile' button will send your file to the application server
for analysis and take you to the 'Results' page. The
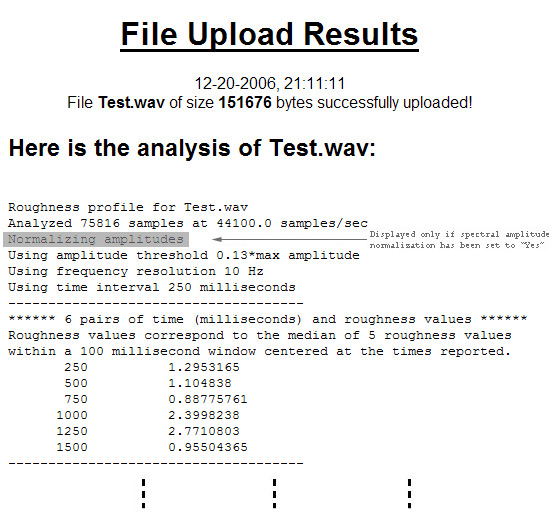
results will include a set of time/roughness pairs at the user-defined time
interval (default: 250ms) by ascending time, followed by a list of the
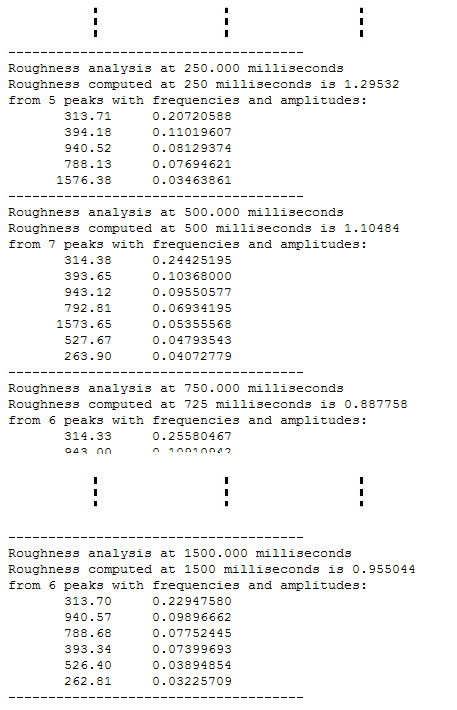
corresponding spectra (frequency and amplitude values by descending amplitude) . The first time/roughness pair and spectrum will be
estimated on or after the time corresponding to half the length of the analysis
window. To
return from the 'Results' to the 'SRA' page, use the browser's 'Back'
button or hit the 'Backspace' key on the keyboard.
The analysis window length will be determined by the frequency resolution
setting (~320ms for 10Hz and ~160ms for 20Hz) and be centered at times
determined by the time interval setting. This setting (default: 250ms) is not
limited by the analysis window length and can be as short as 1ms, although such
short time intervals may be both impractical (in terms of the amount of data
reported) and meaningless (in terms or roughness changes). If the time-interval field is left blank, the analysis
will return an error. The earliest (latest) point within a
file for which a roughness value can be calculated is 158ms (for 10Hz
frequency resolution; 79ms for 20Hz frequency resolution) from the beginning
(end) of the submitted file.
The degree of precision of the spectral analysis
(in terms of time, frequency, and amplitude estimates) is much finer than the
one required for roughness calculation (read about the
spectral analysis method). It captures fast, fine spectral time-variance
that does not necessarily correspond to perceivable roughness variations.
To reduce this effect, the roughness value reported at any given time
corresponds to the median of 5 roughness values calculated from 5 equally-spaced
spectra within an 100ms window (i.e. at -50ms, -25ms, 0ms, +25ms, and
+50ms), centered at the time reported.
The precise time for each spectral distribution used to calculate the reported roughness
values is recovered in the spectral distribution reports.
The
sections below outline the segments of the 'Roughness Profile' Results page
and include:
a) a report of the analysis parameters and the roughness profile of the submitted file (i.e. a list of
time/roughness pairs by ascending time) and
b) the spectral profile of the submitted file [i.e. spectral
distributions (by descending amplitude) corresponding to the analyses at the requested times].
Tip: Depending on the roughness profile time-interval selected and
on the research question of interest, the roughness profile obtained may need to
be modified by using 5- or 7-point running-average values in order to better
reveal data trends.