The initial stage of any musical activity
(or even ideation) involves
a) sense perception of basic acoustic features:
intensity, frequency, spectral distribution, duration, and sound wave
direction, and b) auditory processing, in the auditory cortex, of
the corresponding sonic features: loudness, pitch,
timbre, perceived duration, & sound source
localization.
Each sonic feature is linked to a primary
acoustic feature. E.g.: _ loudness to intensity; _ frequency
to pitch;
_ spectrum to timbre;
_ duration to perceived duration;
_ sound-wave energy differences between
the two ears to sound-source localization.
However, each
sonic feature also depends, to some degree, on all other acoustic features.
Sonic (i.e. perceptual) attribute of sound waves
that distinguishes them on a quiet-loud scale,
related mainly to intensity.
Loudness & Intensity
All else (i.e. frequency*,
spectrum**, duration, & sound wave direction) being equal:
Increasing/decreasing intensity I (in
w/m2) or SIL (in dB)
increases/decreases loudness.
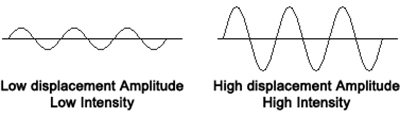
(Intensity is proportional to the
square of displacement amplitude)
Loudness and Intensity are
related logarithmically: as intensity rises, an increasingly larger amount of
intensity is needed to produce the same
increase in loudness. To capture this, we use a logarithmic scale
for Sound
Intensity Level (SIL),
constructed relative to the lowest audible intensity and measured in
decibels (dB).
Lowest audible intensity: I0=10-12w/m2; SIL0=0
dB.
Highest safe intensity: =1w/m2;
SIL=120dB Average dynamic range of human hearing:
120dB (@ 1000Hz;
it changes with frequency).
Key Facts:
_ Doubling the intensity, in w/m2, corresponds to
SIL
increase by 3dB.
_
Doubling the loudness corresponds to
a) intensity increase by a factor of 10 and to
b) SIL increase by 10dB
Just Noticeable Difference (JND) for
SIL
(i.e. minimum SIL change that can be perceived as a loudness change):
~1dB at moderate levels
and middle frequencies.
The SIL JND increases at frequencies below/above middle
frequencies.
For starting levels > 95-100dB the SIL JND increases at all
frequencies.
Note: Sonic energy is
often expressed in terms of Pressure & SPL, rather than of
Intensity & SIL.
SPL and SIL scales are equivalent but
Intensity is easier to treat logarithmically.
Loudness & Frequency
All else (i.e. intensity,
spectrum, duration, & sound wave direction) being equal:
Middle frequencies (1-6kHz) have
lower threshold and larger dynamic range than higher frequencies,
which have lower threshold and larger dynamic range than lower
frequencies.
Alternatively: Sensitivity and
dynamic range are highest/largest at middle frequencies,
lower/smaller at high frequencies, and lowest/smallest at low frequencies.
At low SILs, loudness depends strongly on frequency (i.e. at low SILs,
signals of the same level will vary significantly in loudness,
depending on frequency). The same SIL sounds loudest at middle
frequencies, quieter at high frequencies, and quietest at low
frequencies.
As SIL increases this effect decreases and the ear's frequency
response becomes increasingly flat (i.e. same SILs sound
almost equally loud regardless of frequency).
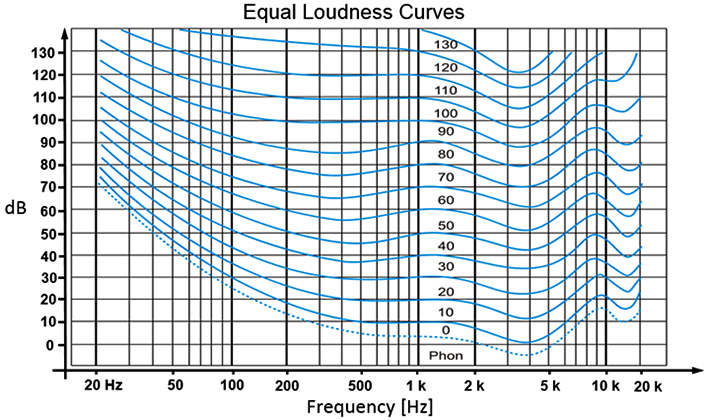
The Equal Loudness
Curves/Contours (graph to the left) are lines that describe the above relationships,
i.e. the dependence of loudness on frequency and how this
dependence changes at different SILs.
All frequency-SIL pairs on a given blue contour-line sound
equally loud, as loud as the 1000Hz-SIL pair on the same
contour line.
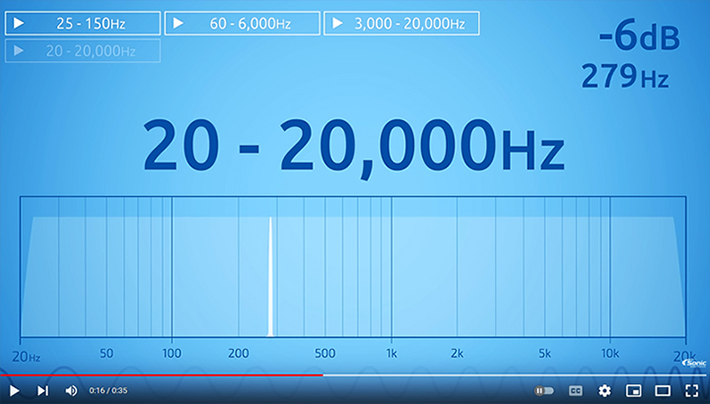
Click to the left for a 20-20,000Hz sweep tone
with steady SIL.
Notice how loudness changes with frequency,
even though SIL remains fixed.
Loudness Level Unit:
Phon.
At 1000Hz, Sound Loudness Level (SLL, in Phons) and Sound Intensity Level
(SIL, in dB) are identical.
Different frequencies that sound equally loud are located on or near
the same contour line on the equal loudness curves graph and have the same loudness
level (in Phons) but, most likely, different SILs (in dB).
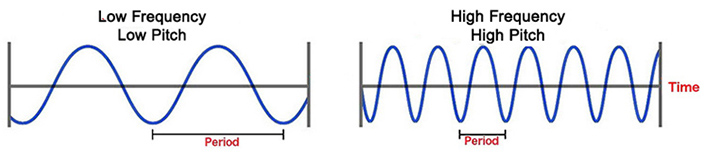
*Frequency: Number of full
vibrations (cycles/oscillations) per second, measured in Hertz
(Hz). The primary physical correlate to the sensation of pitch.
*Spectrum:
The frequency spectrum of a complex sound is a "recipe,"
indicating the type (frequency) and amount (intensity) of
each ingredient (sinusoidal frequency component) required to make the
corresponding complex sound (see the three graphs, below).
Correspondingly, spectral distribution describes how
intensity level (i.e. sonic energy) of a given sound
is distributed across the frequency range of hearing.
For sounds corresponding to periodic signals, also called harmonic
signals (such as the signals corresponding to most musical
sounds), the lowest frequency component is the 1st harmonic
component or "the fundamental" (sometimes designated as �0).
All other harmonic components (also called harmonics) have
frequencies that are integer multiples of the frequency of
the fundamental. That is, if the fundamental frequency is
1�0, then the components above the fundamental have
frequencies 2�0, 3�0, 4�0 (referred to as 2nd, 3rd, 4th
harmonic) and so forth.
Periodic (harmonic) complex signals have a rather definite
pitch that matches in frequency the frequency of the
fundamental component. This appears to be the case even if
the fundamental component is not present in the signal�s
spectrum (phenomenon of the 'missing fundamental').
All other types of signals/spectra are non-periodic & are called
inharmonic.
We will return to frequency and
spectrum later in the course.
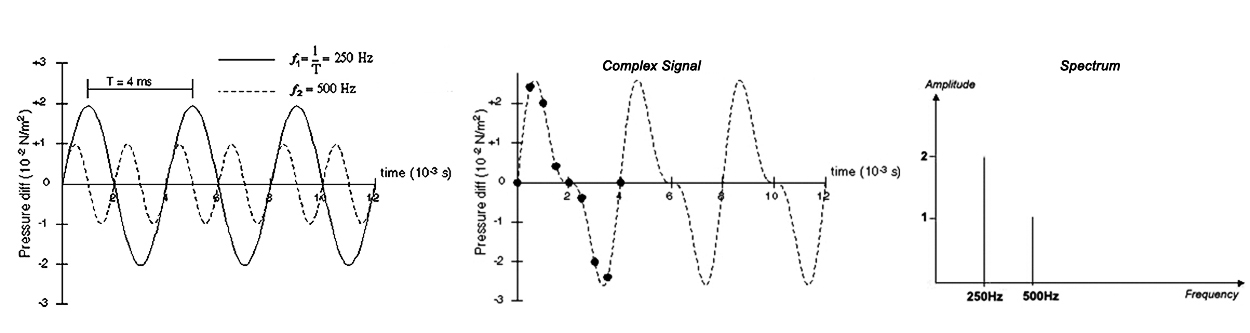
Spectrum
(right) of a 2-component complex signal (middle) resulting form the
linear superposition of two sinusoidal signals (left).
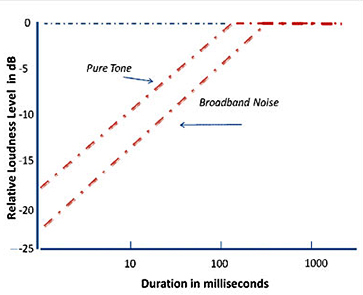
Loudness & Duration
All else (i.e. overall level,
center frequency, spectral bandwidth, & sound wave direction) being equal:
For short durations up to ~200ms (for
narrow spectra / narrow-band signals) and up to ~400ms (for wider
spectra / broadband signals), the longer the signal the louder it
appears.
For moderate durations and intensity
levels, duration has no effect on loudness.
For longer durations, intense sounds may reduce loudness due
to the auditory system's
_adaptation (i.e. adjustment to
higher level baseline);
_fatigue (i.e. temporary
reduction in sensitivity); or
_damage (i.e. permanent loss of
sensitivity).
The more intense the sound (e.g. >90dB), the
shorter the time exposure (e.g. <2hrs) sufficient to cause permanent
hearing damage.
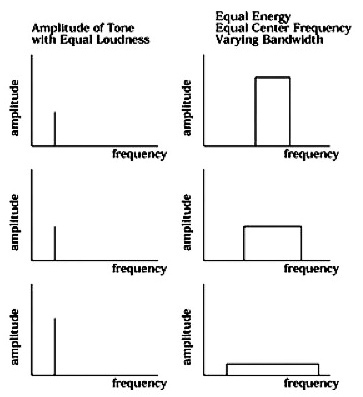
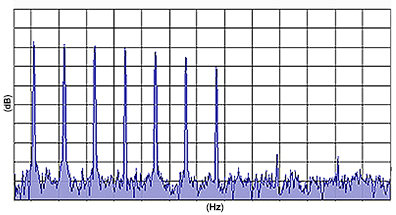
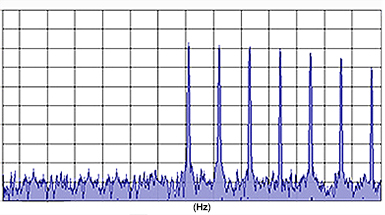
Loudness & Spectrum
For high-SPL complex sounds*
(no effect at low SPLs), and all else being equal (i.e. overall
intensity, center frequency, duration, &
sound wave direction):
The wider
the spectrum (i.e.
the larger the spectral bandwidth / the
larger the frequency range occupied by the spectrum), the more
likely for the spectrum to correspond to more critical
bandwidths* in the ear and
the louder the sound (see to the
left). Conversely, the narrower the spectrum, the more likely for
multiple frequency components to fall within the same number of critical
bandwidths and the quieter the sound.
In addition, the more
components within the same critical bandwidth the more likely
for loss of sonic clarity due to: a)
interference artifacts (i.e. beating / roughness sensations) and
b) masking
(i.e. covering of low-intensity components by
high-intensity ones).
[ details on
interference and masking ] So: The larger the
bandwidth occupied by a musical arrangement the louder and the
clearer the sound.
*Complex
Sound: Complex sounds are represented by
complex (i.e. non-sinusoidal) signals and contain
multiple frequencies, each at its own intensity level,
represented in the complex sound's spectrum.
With very rare exceptions, all sounds we encounter (musical
or otherwise) are complex sounds.
*Critical Bandwidth:
Critical bandwidth refers to the range of frequencies around
a given frequency component, within which the auditory system is unable to
resolve and process other frequency components. Its size
varies depending on several factors, including center
frequency and intensity level. The concept is essential to the
understanding of loudness and pitch perception and of the
interaction among different simultaneous frequencies and phenomena such as
masking and interference.
More later in the course.
All else (i.e. intensity,
spectrum, duration, & sound wave direction) being equal:
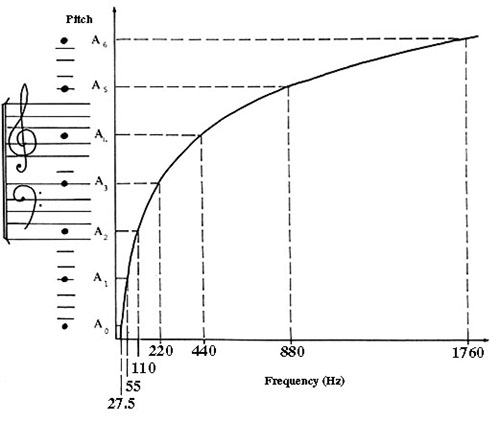
Increasing/decreasing frequency f
(in
cycles/sec or Hz) increases/decreases pitch.
Similarly to the loudness and
intensity, pitch and frequency relate logarithmically:
addition in perception (pitch) corresponds to multiplication in
the physical variable (frequency). As the frequency rises, the
same pitch interval corresponds to increasingly larger frequency
differences (see the figure to the left; from Campbell & Greated, 2001).
For example, pitch increase by an octave interval corresponds to
frequency doubling. So, raising 220Hz by an octave interval
means adding 220Hz, while raising 440Hz by an octave means
adding 440Hz. [ revisit
Salant, 2024, as needed, for a
Music Theory outline ]
Lowest frequency that gives rise
to a pitch sensation: 20Hz.
Highest frequency that our hearing mechanism can perceive:
20kHz
(20,000Hz).
Just Noticeable Difference (JND) for
frequency (minimum frequency change that can be perceived as pitch
change): ~0.3-1% of frequency, depending on register (i.e. on
frequency region).
Expressed differently, it corresponds to
approximately 1/12th of an equal-tempered semitone (2 semitones
in a whole tone; 12 semitones in an octave), or 5-8 cents (1
cent = 1/100th of a semitone). The frequency JND for complex tones may
larger or smaller,
depending on spectral context.
Click left to listen to pairs of successive pure tones (i.e.
tones whose spectra contain a single sinusoidal frequency component) ranging
from 440-441Hz to 440-448Hz. What is the smallest frequency
difference you perceive as a change in pitch?
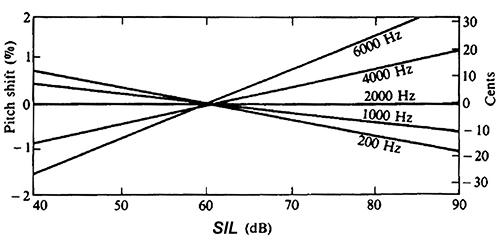
Pitch & Intensity
All else (i.e. frequency,
spectrum, duration, & sound wave direction) being equal:
Changing sound intensity level SIL (in
dB) will change the pitch differently, depending on
frequency.
Increasing SIL will
_ lower the pitch of a low frequency tone; _
have no noticeable impact on the pitch of a middle frequency
tone;
_
raise the pitch of a high frequency tone.
In addition, the
introduction of a high-level tone may change the
perceived pitch of an existing low-level tone, even if the
frequency of the low-level tone remains unchanged.
_For low-level tones with frequencies
well above the frequency of the high-level
tone, the perceived pitch will rise. _For low-level tones with frequencies
well below the frequency of the high-level
tone, the perceived pitch will drop.
In other words, introducing a
high-level tone will push the pitch of existing
low-level tones away from it, assuming frequency
separations beyond one critical bandwidth. If
high- and low-level tones are close enough in frequency
to fall within the same critical bandwidth, the
high-level tone will mask (i.e. render inaudible)
the low-level tone.
Pitch &
Duration
All else (i.e. overall level,
(fundamental) frequency, sound wave direction, & spectral distribution) being equal::
A tone must last more than a
minimum amount of time (~10-60ms, depending on frequency and
intensity) in order to sound more than a 'click' and convey a
clear sense of pitch.
Previous experience and context can often override such psycho-physiological
limits, allowing listeners, for example, to make pitch, judgments for tones
with durations below the suggested thresholds.
Listen to a melody performed using 7
tones shortened to clicks (2 signal cycles per note).
_Stripped from context, the melody is unrecognizable, to most listeners.
_If listeners are told
to what melody these 7 tones belong, they are able to
identify it. _After listeners have been primed to
listen to this tune, some may continue to hear it
even if the 'notes'
represented by each shortened tone
follow a random pitch pattern.
Pitch & Spectrum (pitch of complex
tones)
All else (i.e. overall level,
duration, & sound wave direction) being equal:
The pitch
of periodic complex tones with harmonic spectra (i.e. spectral components with frequencies that are
integer multiples of the frequency of the lowest component,
called 'fundamental')
matches (in general) the frequency of the fundamental component.
This is the case regardless of whether or not the fundamental
component is perceivable (i.e. even when it is too low in
level and/or masked) and even if it is missing from the tone's spectrum
all together.
Listen to a pair of complex tones illustrating the
phenomenon of the missing fundamental. Both have
fundamental of 300Hz and up to 15 components (ramp spectrum:
An = A1/n for all components). The
first tone has all 15 components while the second is missing
the first 5. As you can hear, removing these first 5
components does not change the tone's pitch, which continues
to match that of 300Hz.
Frequency components &
region most significant to pitch: For harmonic
complex tones, the more low-frequency components are removed,
along with the fundamental, the more likely for the pitch
sensation to be altered. In addition, mistuning or
removing a harmonic complex tone's components within the
~400Hz-1,500Hz region appears to impact the tone's pitch the
most. Listen to
this example. It includes 13 harmonic complex tones,
with fundamental of 600Hz, played in succession.
The first tone has all harmonic components from the 1st to
the 16th and each successive tone drops one component, starting from the fundamental,
until
only the highest 3 components remain. What happens to the
pitch?
Perceiving a complex signal's individual
components:
Harmonic complex tones are perceived as a unitrather than a set of multiple pure tones, one per
spectral component. However, the
individual harmonics can be heard if we
draw attention to them by removing them
and re-introducing them (after Houtsma
et al.,1987;
based on an earlier experiment by von Helmholtz, 1862).
Tuva
throat singers (peoples of Tibet and the Siberian
grasslands) exploit this phenomenon to create
musical passages where one singer appears to produce
two pitches simultaneously: one acting as a fixed
drone and one performing a sort of melody. In these
passages: a) the single fundamental frequency produced acts as
a background drone and b)
harmonic components, associated with this
fundamental, are selectively removed and
re-introduced by the performer via modifications to
their vocal tract,
and act as the melody line [ more information & video/audio examples,here
&
here ].
The
pitch of complex tones with inharmonic spectra
(i.e. spectral components whose frequencies are not
integer multiples of some 'fundamental' component,
is unclear, ambiguous, or non-existent. Inharmonic
complex tones may elicit more than one competing pitch
sensations, may resemble chords, or may sound as noise,
depending on their spectral distribution.
As illustrated below,
however, changing the spectral peaks of inharmonic complex
sounds without changing the frequencies of their sinusoidal
components can result in a distinguishable change in pitch,
matching the frequency change of the spectral peaks. This
highlights the perceptual salience of changing vs. static
stimuli and provides additional evidence of the dependence
of pitch on spectral distribution.
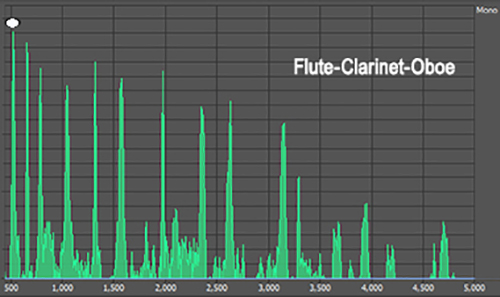
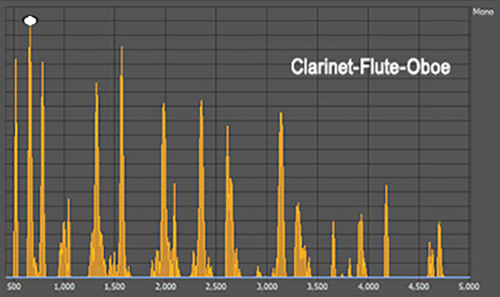
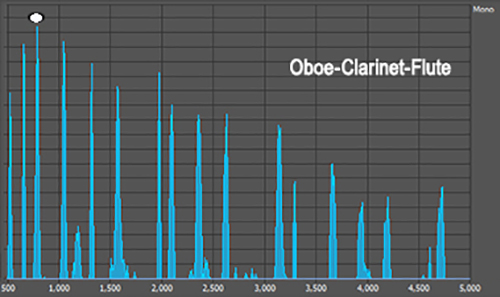
Now, listen to this example
of a chord melody, consisting of
the five-chord sequence:
(1)-(2)-(3)-(2)-(1).
All three chords are major, include exactly the
same notes (C5, E5, & G5), in the same order, and have inharmonic spectra (i.e.
their spectral components are not integer multiples of a
single fundamental, even though the spectra of the
individual notes in the chords are themselves harmonic).
The frequencies of the
components are identical among chords but the spectral
envelopes* (i.e. relative intensities of the
components) are different and depend on which instrument
plays what note (a flute, a clarinet, or an oboe).
*Spectral
Envelope: a boundary curve that traces
the peaks of the spectrum, capturing how
energy is distributed across the frequency
range.
The melody you hear
(C-E-G-E-C) tracks the position of the flute in each
successive chord, because the flute's fundamental frequency
provides the spectral peak for each chord's spectrum (see the images to the left).
In other words, the melody you hear matches the pitch
changes corresponding to the changes in the flute's
fundamental frequency.
Watch the video, below.
A similar effect can be
produced through spectral shaping of noise bands. Pitch
perception will track changes in the spectral peak of
the noise spectral envelope, imposed by the spectral
shaping filter. In fact, appropriate shaping of the
spectral envelope of white noise signals can help
generate speech signals [ speech-shaped noise
example ].
Minor deviations from harmonic spectra
(up to ~1-2% of frequency) and the way these interact
when, for example, several instruments perform together
in unison change the timbre of the combined sound rather
than its pitch. They produce what is referred to as
'chorus effect': richness of
ensemble sound due to slow and varying beating rates among the slightly detuned
components of the complex tones involved. Chorus, Phaser, and Flanger effects
are all based on the same principles, differentiated by
modifying the values of the same variables [
video exploring all three effects ]
The Octave
The
octave interval (corresponding to frequency
doubling) is significant because tones separated by
this interval sound remarkably similar and, when
simultaneous, perfectly blend into a single pitch
percept, even though the higher frequency is clearly
higher in pitch. The perceptual "sameness" conveyed
by octave intervals is
cross-cultural and is referred to as: pitch chroma.
We return to this topic later in the course.
Multidimensional sonic (i.e. perceptual)
attribute of sound waves that describes their character/quality, related
mainly to spectral distribution and expressed through an extensive list
of largely -and necessarily- vague adjectives.
Real-time MRI scans of four professional musical theatre performers singing vowels.
Credit:
ProfEdwardsSU
Timbre & Spectrum
All else (i.e. overall intensity,
fundamental frequency, duration, and sound wave direction) being equal:
Changes in spectral
distribution correspond to a variety of timbral changes.
Example 1: A sustained tone played by a
Bb soprano clarinet is followed by the same tone presented by gradually
increasing and then decreasing the number of spectral components (from
the lowest to the highest in frequency and back). Example 2: A 220 sine tone of amplitude
A followed by several more tones in which 7 additional
harmonic components are incrementally added and removed (i.e. 2f, 3f, ... 8f), at
amplitudes equal to A/n (n : number of harmonic component),
returning back to the 220 sine tone.
Rather than tracking every
frequency component of a given spectral distribution, we
capture the key timbral dimensions of musical sounds by
exploring the following
spectral energy distribution acoustic parameters
[ based on
Grey, 1977;
McAdams,
2013;
Kendall
et al., 1999;
Lakatos,
2000 ]:
spectral centroid (center of amplitude-weighted frequency
distribution);
spectral bandwidth (spread of frequency distribution
= Highest Frequency - Lowest Frequency);
spectral density
(number of
frequency components per critical band); and
spectral inharmonicity
(departure from integer multiple
relationship relative to some fundamental
frequency)
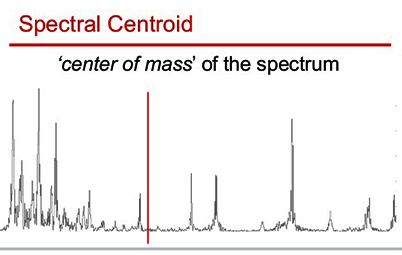
Spectral Centroid
A measure capturing the center of energy
distribution in a complex signal's spectrum, within a given
time window. It is manifested perceptually as
a sound�s degree of
nasality-brightness, the primary dimension
of timbre [ e.g.Kendall et al.,
1999 ].
In general:
_ Higher centroid values
correspond to spectra with more high-frequency energy
and to
more 'nasal' &
'brighter' sounds.
_ Lower centroid values correspond to spectra with
more low-frequency energy
and to
more 'acute' &
'duller' sounds.
Qualitatively,
spectral centroid can be
likened to a spectrum's 'center of gravity' or
'titter-totter fulcrum,'
where amplitude values represent 'weights' and frequency values
represent the 'position'
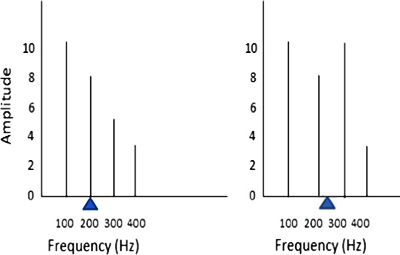
of each weight on the titter-totter (see images to the left).
_ If this 'gravity center' is calculated relative to the
given spectral bandwidth (i.e.
if the centroid
value is calculated
independent of the lowest frequency in the spectrum),
then:
two spectral
distributions with the same spectral centroid have the
same spectral
envelope*
slope and the same degree of 'nasality,' regardless of
absolute frequency boundaries.
_ If this 'gravity center' is calculated
based on absolute frequency values (i.e.
if the centroid
value is calculated taking into account
the lowest frequency in the spectrum),
then:
two spectral
distributions with the same
spectral envelope slope (i.e. same nasality)
but
different fundamental
frequencies (or, more generally, different low frequency
boundaries)
defer in 'brightness': the higher the
fundamental (or lowest) frequency the higher the
brightness.
E.g.
The two spectra, below, correspond to similar degrees of
nasality (have the same spectral envelope slope), with the one
to the right sounding brighter [ details inMarozeau
et al., 2003;
Marozeau
& Cheveign�, 2007 ].
[*spectral envelope: a boundary curve that traces the peaks of the spectrum, capturing how
energy is distributed across the frequency range]
(same nasality - different brightness)
Descriptive
adjectives range from
boomy, muffled, dull, & warm
(lower centroid values); to
acute, vibrant, bright, &
nasal (mid-high centroid values); to tinny, piercing, &
screeching (higher centroid values).
Listen to pair of harmonic complex tones with 7
components each, the same fundamental frequency (220Hz), but different centroid values.
The
first tone has most of its energy in the low components (lower centroid value), while the second
has most of its energy in the high components (higher centroid value).
The didjeridu is an example of an instrument whose performance
practice and aesthetic qualities rely heavily on spectral centroid
manipulation (remember "Green Frog"
from Module 01).
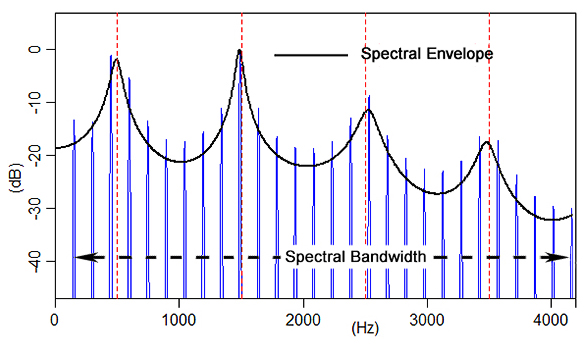
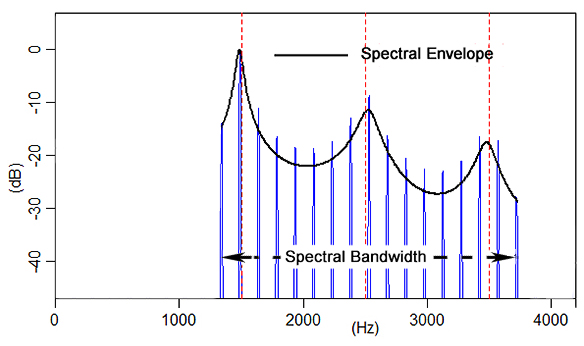
Spectral Bandwidth
A measure of the degree of overall energy spread along the frequency
dimension.
It
corresponds to the hearing mechanism's physiological response width
and is
manifested perceptually as a sound's degree of width/richness/fullness/thickness
vs. narrowness/plainness/lightness/thinness.
Descriptive adjectives range from thin, narrow,
& plain to
rich, full, & thick. As previously
noted, spectral bandwidth also impacts loudness, depending on the number of corresponding critical bands.
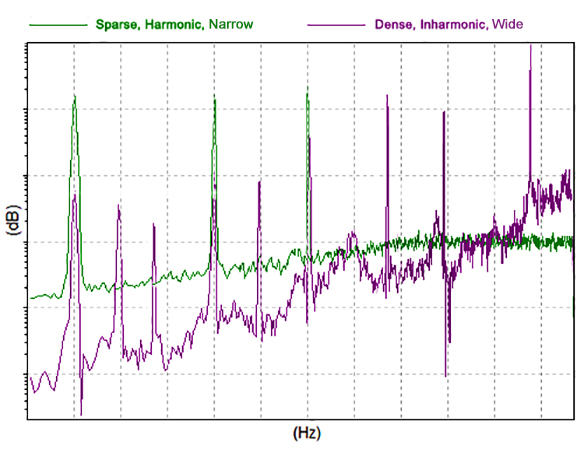
Spectral
Density
A measure of the number of frequency components per critical band.
It
corresponds to the degree and type of interference among spectral
components within the ear (or of masking* for components with large
intensity differences)
and
captures perceptions described by adjectives that range from
hollow, clear, crisp, & smooth, to pulsating,
buzzing, rough, muddy, & noisy. [*reminder: masking
refers to: the perceptual erasure/cover of a lower
level tone (maskee) by a higher level tone or band of
noise (masker)]
Spectral Inharmonicity
A measure of spectral deviations from
harmonic (i.e. integer multiple) relationship among
components.
It corresponds to instability in the response of the hearing mechanism
to inharmonic spectra.
As noted under 'Pitch,' minor deviations from harmonic spectra
(up to ~1-2% of frequency) and the way these interact when, for
example, several instruments perform together in unison, produce what is referred to as
'chorus effect': the
undulating quality, 'liveness,' and richness of
ensemble sound due to slow and varying beating rates among the slightly detuned
components of the complex tones involved.
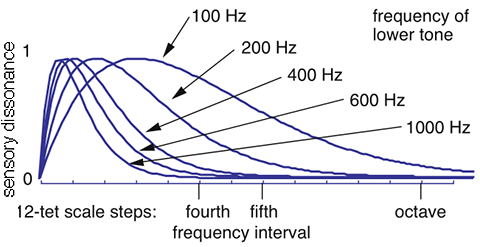
Spectral density
and inharmonicity are captured by models
estimating/quantifying the degree of sensory dissonance (i.e.
degree of beating and/or
roughness) in a sound, resulting form the
interference of two or more frequency components within the ear.
Beating: loudness fluctuation
perceived when two or more spectral components of a sound are
separated by up to ~15Hz. Roughness: a buzzing, harsh, raspy sound quality accompanying
spectra with two or more frequency components separated by
~15-150Hz (upper limit depending on the frequency region in
question and on the corresponding critical bandwidth).
The smaller the level difference between the interfering
tones the stronger the corresponding beating/roughness
sensation.
The larger the level difference between the
interfering tones the more likely for the more intense tone to
mask the less intense tone.
The beating and roughness
sensations are directly related to the degree of sensory
consonance / dissonance and are only relevant to
harmonic intervals. They depend on clear-cut
physical/physiological considerations, applicable to all
cultures.
However, how "pleasant" or musically consonant
a given degree of roughness is judged to be is
culturally defined, with no universally "correct"
judgment.
The general, musical
concepts of consonance and dissonance depend on many
variables, additional to sensory
consonance/dissonance. What we consider musically consonant
(e.g. acceptable, pleasing, fitting, correct) or dissonant
(e.g. unacceptable, disturbing, unfitting, wrong) depends on melodic,
harmonic, rhythmic, and dynamic context, and may change: a) with time (historical context), b) with tradition (cultural context), or even c) within a single tradition, style, or piece of music (musical
context).
[ more on musical consonance
- video on
the physics and music theory of musical consonance ]
Formants
The resonant characteristics
(i.e. the tendency to respond better to, and
therefore amplify some frequencies over others) of an
instrument, voice included, enhance certain spectral
regions of the produced sounds.
[
more on resonance ] When these enhanced spectral regions
remain the same, regardless of fundamental frequency (i.e.
regardless of the note produced, or of pitch register), they are
called formants and contribute to
sound source recognition and identification.
Formants appear to be
responsible for the recognizable differences between
various vowel sounds [ see
here ] and have been used successfully
in speech recognition and synthesis applications.
The vowels in this resource
have been created by spectrally shaping
generic sawtooth spectra using spectral envelopes corresponding to
each vowel's first 4 formants
[ more details
here ].
Many emotional states are accompanied by characteristic/typical facial
expressions and, consequently, characteristic vocal fold tension and/or resonator shaping.
This
corresponds to characteristic spectral shaping that consistently
modifies vowel formants.
The accompanying, consistent timbral features permit
the pairing of emotional states to timbral
"signatures." For example, we are able to
tell when someone is smiling while they speak, even
in the absence of visual and linguistic cues [ e.g.
Torre, 2014 ].
The average spectrum of a complex
signal describes its energy distribution across frequencies but does not
capture if/how it changes with time, a change that also influences timbre.
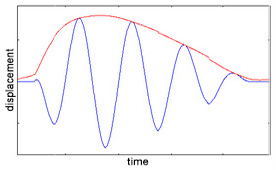
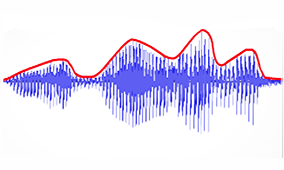
Signal Time-Variance
Signal time-variance can be represented through a
signal's envelope: a boundary curve
that traces the signal's amplitude through time, capturing how
the total energy in the signal changes with
time. It encloses the area outlined by all maxima of the
two-dimensional signal (see top-left: signal in
blue, envelope in
red).
Based
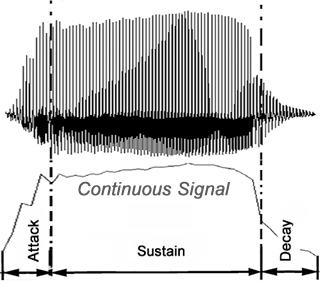
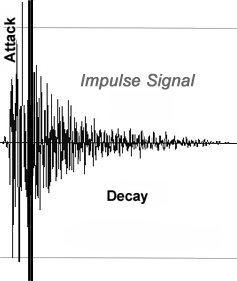
on envelope shapes, we can classify signals in two broad categories:
_ Continuous Signals: most of the energy is
in the "steady state" or "sustain" portion of the
envelope
(e.g. signal of a bowed violin string).
_ Impulse Signals: most of the energy is in the
"attack" portion of the signal; there's no "steady state"
(e.g. signal of a struck marimba bar).
Signal envelopes are segmented into three portions:
Attack:
The portion of the envelope tracing the development of a
sound signal towards its maximum amplitude/strength. It
represents how energy builds up in a vibrating system and, in music, can be manipulated
through instrument excitation methods (bowing, plucking, blowing, striking,
etc.).
Signal durations shorter than a given signal's
attack portion will significantly impact timbre perception.
This portion contains a signal's onset transients
and contributes to the timbre of any signal, but
significantly more to the timbre of impulse signals. Listen to
3 orchestral instruments presented with the
attack portion of their signal removed. Can you recognize the
instruments? [piano, clarinet, French horn]
Onset (attack) transients are frequency components that are
usually inharmonic, reach higher amplitudes than other
components, die out rather fast, and correspond to a signal's
degree of
noiseness/naturalness. The degree
of level rise/fall synchrony of attack transients
is characteristic
to a given source, assisting in its timbral
recognition and identification.
Steady State / Sustain:
The portion of the envelope during which there is a continuous
supply of energy in a vibrating system and which can be manipulated
through performance techniques (e.g. vibrato, muting,
damping, bowing pressure, driver excitation location).
Decay:
The portion of the envelope that traces the drop in amplitude
(or "decay") of a sound signal from its maximum value to zero,
when energy stops being supplied to a vibrating
system.
It represents how energy stored in a system dissipates
and depends on sound source construction and performance
space.
The significance of envelope to timbre can be demonstrated by playing a sound
backwards; the signal's time evolution changes, while its average
spectral distribution does not.
Click on the image to the
left for a piano-note example.
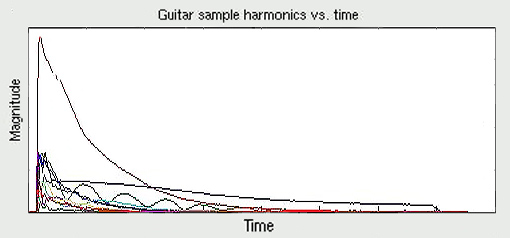
Spectral time-variance is manifested
as changes in the frequency and amplitude of a complex tone's
components with time, and can be represented through
time-variant spectra,
spectrograms, or
individual component amplitude/frequency envelopes.
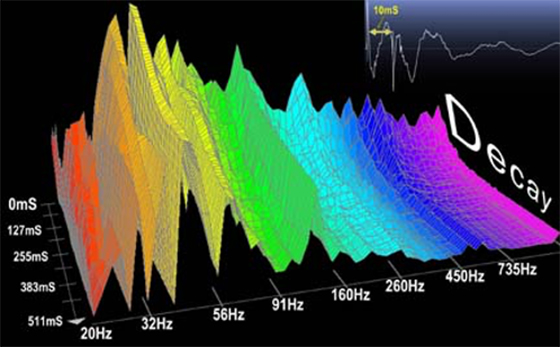
3D Time-Variant
Spectra ('waterfall' plots):
Usually with frequency on the x axis, time on the y axis, and level on the z axis. Watch the video, below, for the 3D time-variant spectra of the three piano
examples in the previous section (in Houtsma et
al.,1987).
2D Amplitude Envelopes of Individual Spectral Components; usually with time on the x axis, level on the y
axis, and spectral component number or frequency in different color/type
lines (image to the left).
Two signals separated by a time delay
that is shorter than a specific time separation threshold of ~2-50ms,
depending on the spectra of the two signals, sound
as one (per Hirsch, 1959; details and analysis in
Divenyi, 2004), with increased loudness and a noticeable change in timbre: the original signal's attack portion becomes less sharply defined, resulting in a timbre with
a rather 'blurry' onset.
Listen to these 3
complex signals with fundamental 600Hz:
(i) one
1-sec-long complex tone, (ii) two complex tones; onsets separated by 30ms, and (iii) two complex
tones; onsets separated by 150ms. _ The
introduction of the second tone in (ii) is perceived as an increase in
loudness and a change in the attack of the first tone.
_ The
introduction of the second tone in (iii) results in the perception of two
tones.
SUMMARY
_
Signal
onset transients correspond to a signal's
degree of
noiseness/naturalness
_ Spectral density & inharmonicity correspond to a signal's
degree of
beating/roughness
_ Spectral inharmonicity
correspond
to a
signal's degree of
fluidity/liveliness (chorus effect - for small departures
from harmonicity)
_
Spectral
centroid correspond to a signal's degree
of nasality and brightness
_
Spectral time-variance correspond to
a signal's degree of naturalness